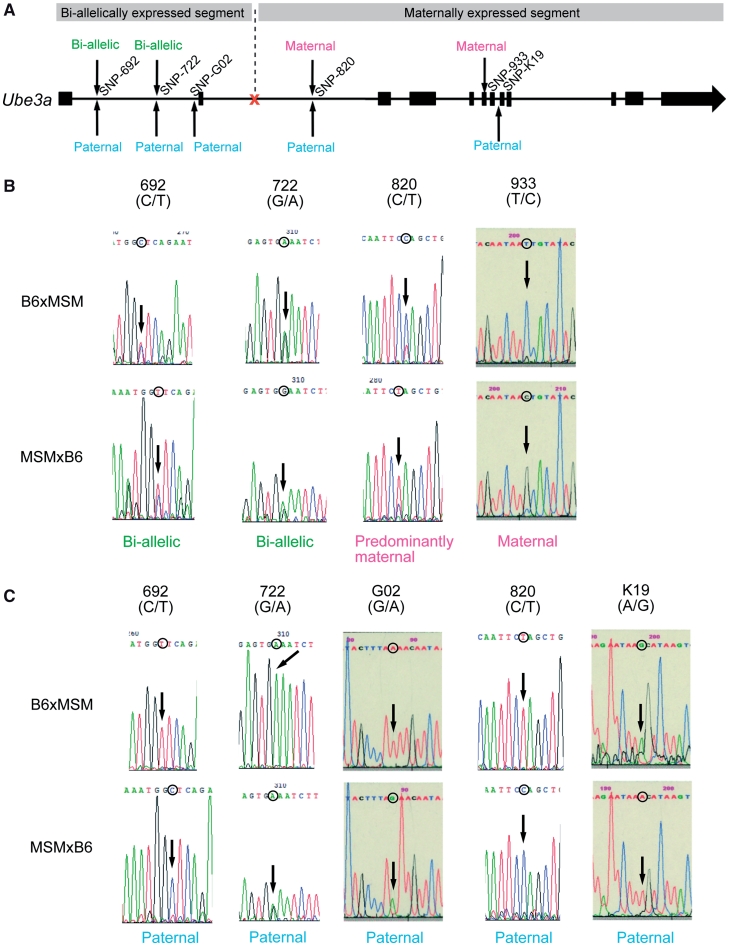
Figure 3.
Expressed alleles within the Ube3a locus. (A) Sequence analysis summary. SNP sites within the Ube3a locus for sequence analysis are indicated by arrows (thick lines and narrow lines indicate exonic and intronic regions, respectively). Expressed allele decisions are denoted for the plus and minus strand. Expression from plus strand means Ube3a sense expression. An orange mark denotes computationally estimated site which shows allelic balance alteration. (B) Sequence analysis results and decisions of expressed allele from plus strand for B6xMSM (upper) and MSMxB6 (lower). (C) Sequence analysis results and decisions of expressed allele from minus strand for B6xMSM (upper) and MSMxB6 (lower).

