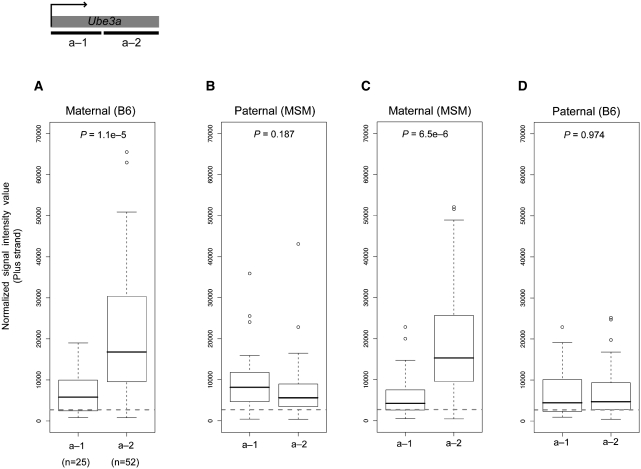
Figure 4.
Comparison of maternal and paternal expression of Ube3a in brain. Comparison of maternal and paternal expression of Ube3a in brain for the two regions, denoted a-1 and a-2, estimated by genomic segmentation analysis. (A) Maternal expression in the BM hybrid, (B) paternal expression in the BM hybrid, (C) maternal expression in the MB hybrid and (D) paternal expression in the MB hybrid. Statistical significance (P-values) was tested with the Wilcoxon test. The number of SNPs in the corresponding regions is indicated in the parenthesis. Dashed line indicates the threshold value to distinguish between expressed and non-expressed SNP sites.

