Figure 1.
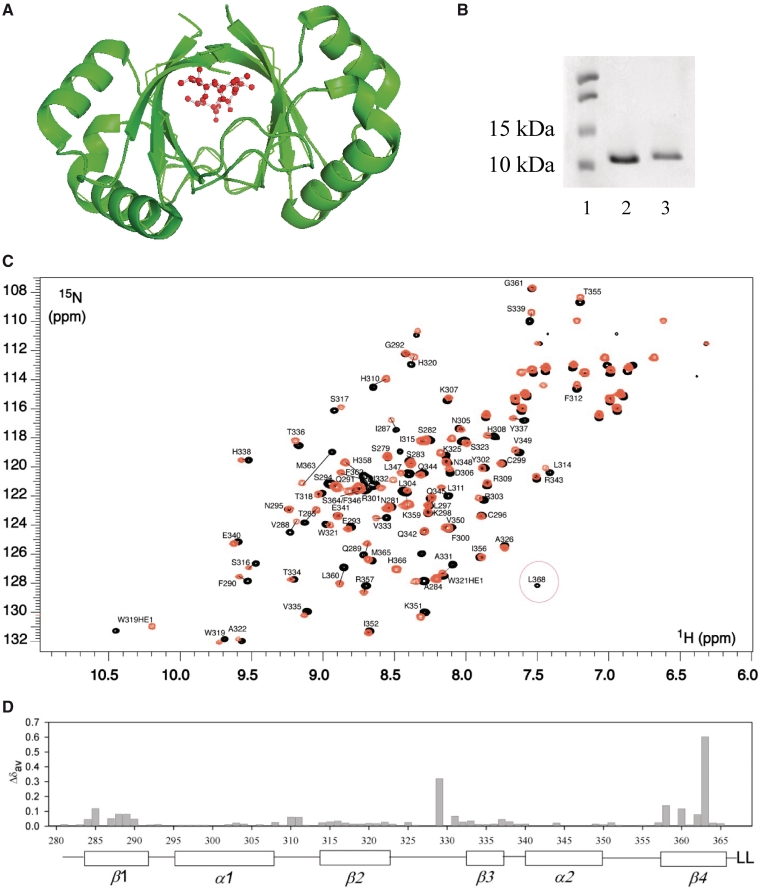
Biochemical and NMR characterization of HPV 6 E2 and E2ΔLL. (A) The HPV 6 E2 β-barrel from PDB 1R8H visualized using PyMol (41). Residues L367 and L368 are highlighted in red. (B) Samples of the purified HPV 6 E2 and HPV 6 E2ΔLL proteins were analysed by SDS–PAGE. The sizes of the markers used are indicated to the left of the gel. (C) Comparison of 1H-15N HSQC spectra of the 6 E2 proteins. The 1H-15N spectra of 6 E2 (black) and E2ΔLL (orange) are superimposed. Peaks that show large chemical shift perturbations between the two forms are connected with a line. (D) Chemical shift perturbations (Δδav) between 6 E2 and E2ΔLL plotted versus sequence number.

