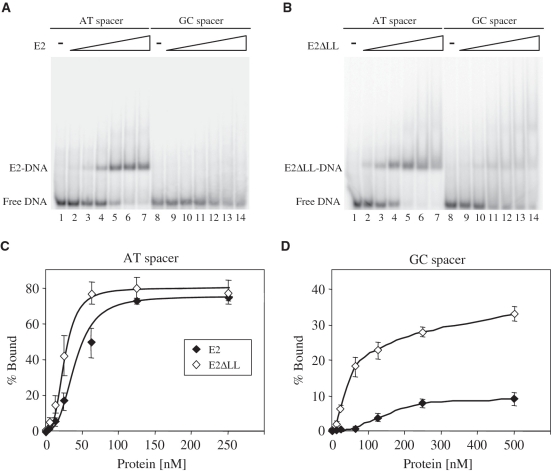
Figure 4.
Specific DNA binding by the 6 E2 and E2ΔLL proteins. (A) A representative gel retardation experiment showing the binding of 6 E2 to labelled E2 binding sites with A:T rich or G:C rich spacer sequences. Lanes 1 and 8 contain no protein, lanes 2–7 contain 5, 12.5, 25, 62.5, 125 and 250 nM protein and lanes 9–14 contain 12.5, 25, 62.5, 125, 250 and 500 nM protein. Free and bound DNA were separated on a 6% polyacrylamide gel and visualized using a PhosphorImager. (B) A representative gel retardation experiment showing the binding of E2ΔLL to the labelled E2 binding sites from (A). Lanes 1 and 8 contain no protein, lanes 2–7 contain 5, 12.5, 25, 62.5, 125 and 250 nM protein and lanes 9–14 contain 12.5, 25, 62.5, 125, 250 and 500 nM protein. Free and bound DNA were separated and visualized as above. (C) A graph showing the binding of E2 proteins to the labelled E2 binding sites from (A). The amount of free and bound DNA was determined using a PhosphorImager and the percentage of labelled DNA bound {[bound labelled DNA/(bound labelled DNA + free labelled DNA)] × 100} is plotted against the amount of protein added. (D) A graph showing the binding of E2ΔLL to the labelled E2 binding sites from (A). Details as above.

