Figure 5.
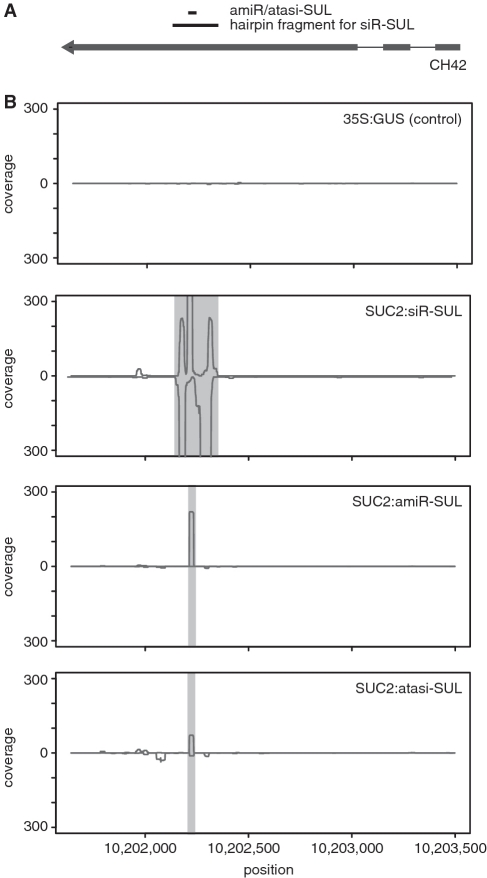
Secondary sRNAs at the CH42 locus. (A) Diagram of CH42 locus. Exons are indicated as thick lines. Regions targeted by primary sRNAs from siR-SUL and amiR/atasiR-SUL transgenes are shown. (B) Small RNA populations at the CH42 locus. About 19–26 nt sRNAs, with a maximum of two mismatches (as in amiR/atasi-SUL), are shown. See Supplementary Figure S6 for perfect-match sRNAs only. Grey regions indicate origin of primary siR-SUL and amiR/atasiR-SUL, respectively.

