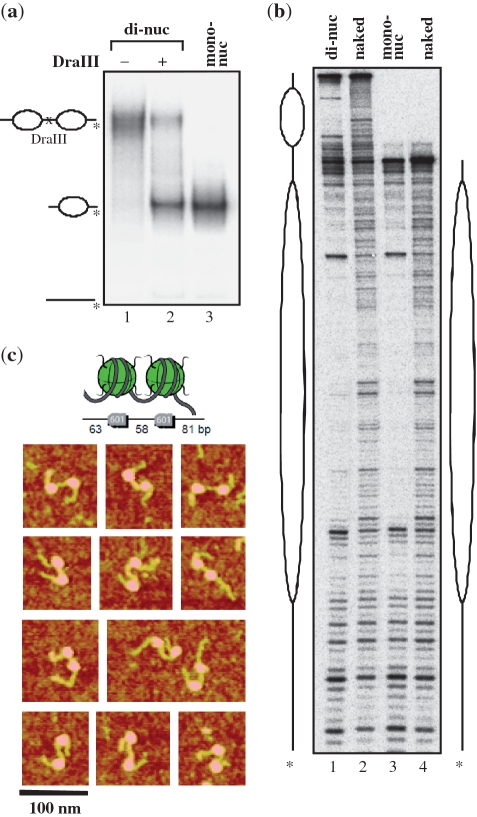
Figure 1.
Characterization of the reconstituted positioned 601 dinucleosomes by EMSA, DNase I footprinting and AFM imaging. (a) Four percent PAGE analysis of the full length 601 dinucleosomes (lane 1) and after partial digestion with DraIII (lane 2) and control mononucleosomes (lane 3). (b) DNase I footprinting analysis of the di- (lane 1) and mono- (lane 3) nucleosomes. The respective naked DNA digestion profiles are also shown (lanes 2 and 4). (c) AFM image gallery of reconstituted dinucleosomes deposited on APTES-mica surfaces and imaged in tapping mode in air.

