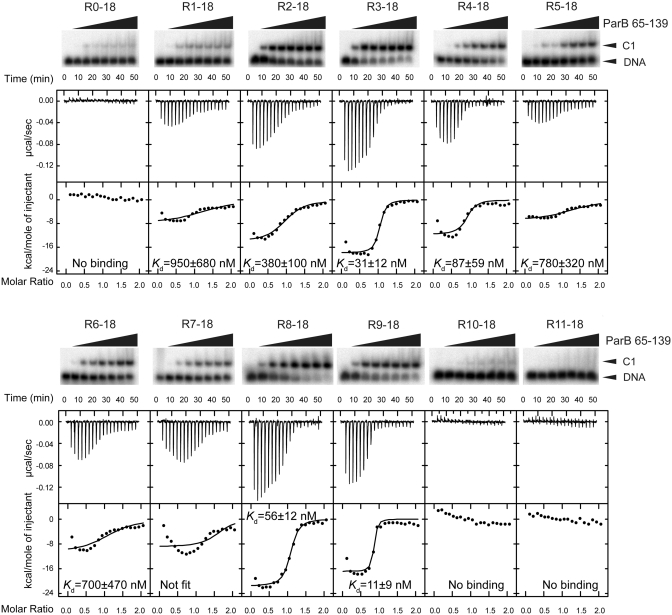
Figure 6.
Binding affinity of individual sites. Twelve 18-bp probes covering repeats R0-R11 were assessed for binding of ParB RHH domain (residues 65–139) by EMSA (top panel) and ITC (bottom panel). The concentrations of ParB dimer in EMSA were 0, 2, 8, 16, 32, 64, 128 and 512 nM. The curves in the ITC panels are the best fit to a one-set-of-sites model that dose not account for possible additional binding events. Fit of the R7-18 data was unsuccessful.

