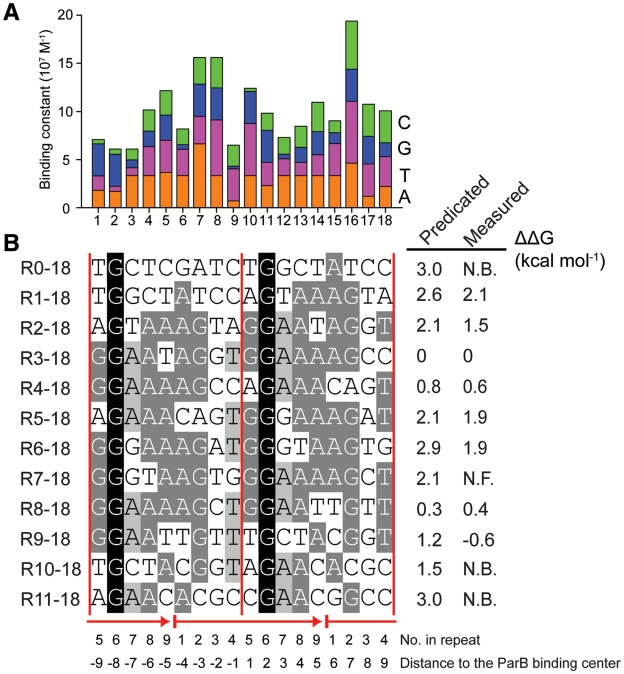
Figure 7.
Sequence recognition of ParB. (A) Binding constants of R3–18 and its point mutants plotted against the position of the replaced nucleotide. For the purpose of illustration, mutant G10C that shows weak ParB binding is set to have a Kd value of 300 nM. (B) The predicated and measured change in the binding free energy relative to R3–18 for 18-bp subsites. Repeats are shown as arrows and ParB binding centers as vertical lines. Each nucleotide is also labeled by its position in a repeat and distance to the central ParB binding center. N.B.: No binding; N.F. Not fit.

