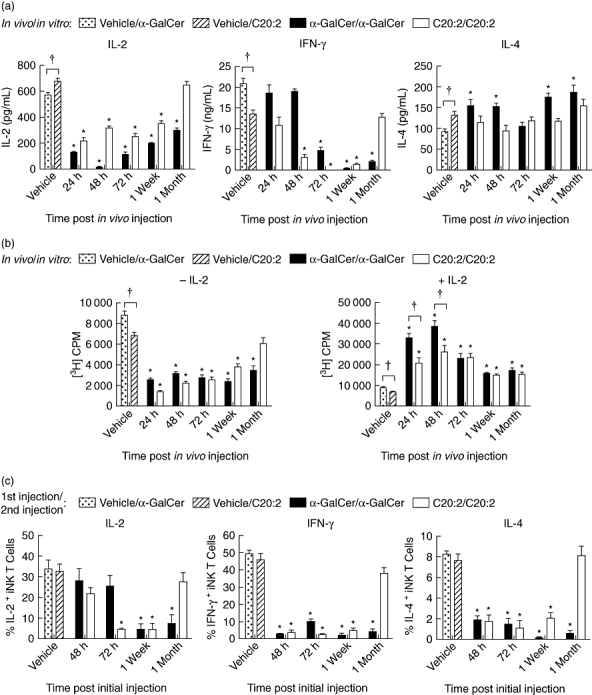
Fig. 2.

Kinetic analysis of induction of invariant natural killer T (iNK T) cell anergy. Non-obese diabetic (NOD) mice (4–6 weeks old; five mice/treatment group/time-point) were injected intraperitoneally (i.p.) with a single dose (4 µg) of glycolipid or vehicle (Veh). Splenocytes were isolated at various times (24 h, 48 h, 72 h, 1 week, 1 month) and then restimulated in vitro with glycolipid (100 ng/ml) for 72 h (a, b). In (a) supernatants were analysed for interleukin (IL)-2, interferon (IFN)-γ and IL-4 content by enzyme-linked immunosorbent assay (ELISA), and in (b) the proliferative capacity of iNK T cells cultured in the presence or absence of IL-2 (5 ng/ml) was assayed by [3H]-thymidine incorporation. (c) After mice were injected with glycolipid (once with 4 µg, i.p.) or vehicle and rested for various times (48 h, 72 h, 1 week, 1 month), they were reinjected with the same dose of glycolipid. Splenocytes were harvested 2 h after the second injection and then cultured in vitro for 3 h in the presence of a protein transport inhibitor, GolgiStop, to block cytokine secretion. T cell receptor (TCR)-β+tetramer+ iNK T cells were stained for intracellular levels of IL-2, IFN-γ and IL-4. Data are representative of four independent experiments yielding similar results and are expressed as mean ± standard deviation (s.d.). *Significant (P < 0·05) reduction between primary and recall responses (vehicle/α-galactosylceramide C26:0 (α-GalCer) versusα-GalCer/α-GalCer, vehicle/C20:2 versus C20:2/C20:2). †Significant (P < 0·05) difference between primary responses to α-GalCer and C20:2 treatments (vehicle/α-GalCer versus vehicle/C20:2).
