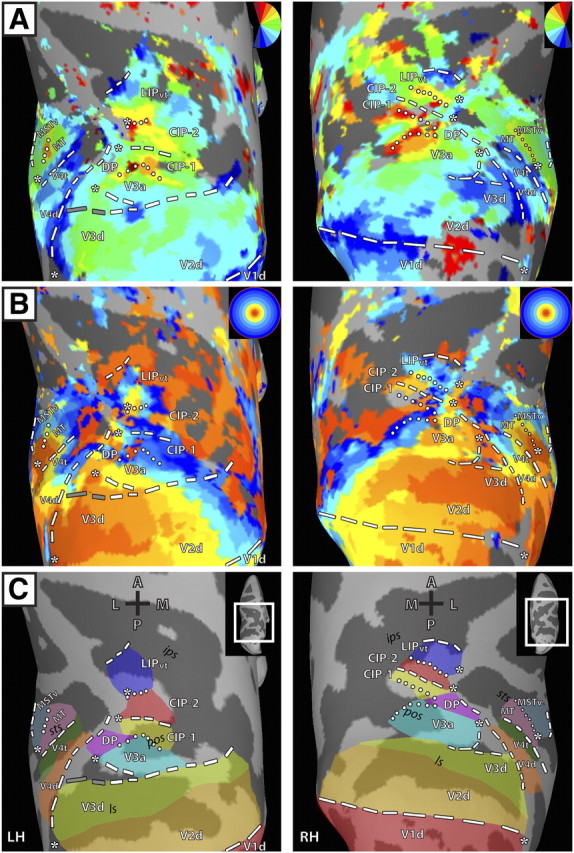
Figure 1.

Polar angle and eccentricity maps in dorsal visual cortex for left and right hemispheres of M1. Inflated surface reconstructions of dorsal occipital and parietal cortex for M1. The left panel shows the topography for the LH and the right panel shows the topography for the RH. A, Polar angle maps for M1. The color code depicts the phase of the fMRI response and indicates the region of the visual field to which the surface node responds best. White lines denote area boundaries formed by phase angles at or close to the upper (dotted) or lower (dashed) vertical meridian. The gray dashed lines denote the discontinuity in the anterior border of area V3d. The surfaces are color coded such that the boundary between the dark gray and light gray represents the points of lowest curvature on the cortex with the midpoint across the dark gray region representing the fundus of the sulcal convexity and the midpoint across the light gray region representing the crown of the gyral convexity. Asterisks indicate representations of central space. Maps were thresholded at ±2 s per cycle SEM variance (see Materials and Methods). B, Eccentricity maps for M1. The color code indicates phase of the fMRI response and the region of the visual field to which the surface node responds best. C, Schematic borders of defined topographic regions overlaid on inflated surfaces to relate the functionally defined areas and the underlying anatomy. A, Anterior; P, posterior; M, medial; L, lateral; ls, lunate sulcus; pos, parieto-occipital sulcus; sts, superior temporal sulcus; ips, intraparietal sulcus.
