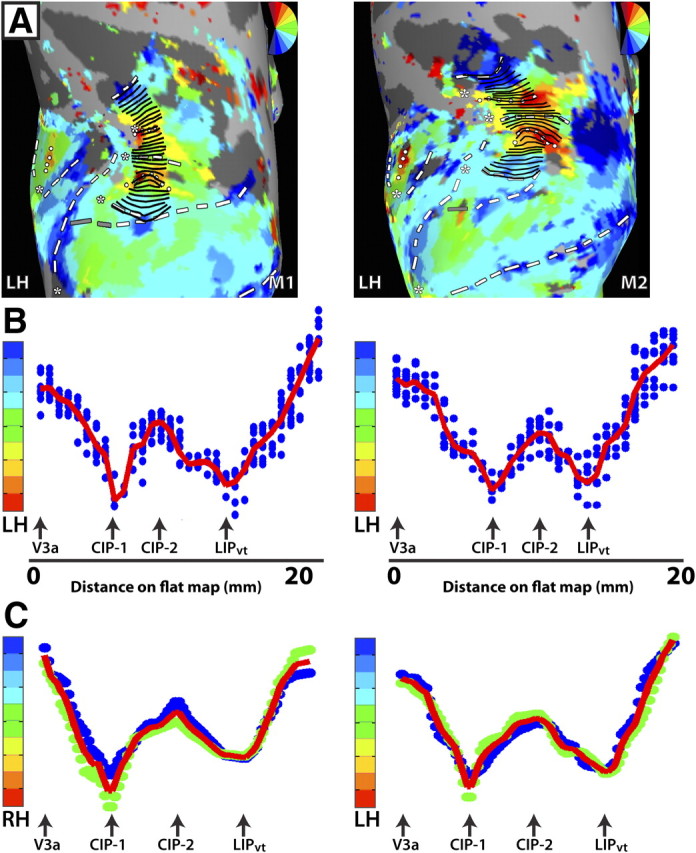
Figure 4.

Analysis of topographic organization within V3a, CIP-1, CIP-2, and LIPvt. A, Polar angle maps of dorsal occipital and parietal cortex for the LH of M1 (left column) and M2 (right column). Response phase was analyzed as a function of distance on the surface by drawing small line segments that run parallel to the polar angle progression and perpendicular to the eccentricity progression. The line segments were successively drawn from the lateral, posterior border of V3a to the anterior border of LIPvt. B, Polar angle phase plot for LH of M1 (left column) and M2 (right column) as a function of distance from the lateral, posterior border of V3a (in mm). The blue dots indicate the phase values for individual nodes located along the line segments. The red line indicates the average phase values as a function of distance on the surface. Note the smooth progression of phase values as a function of distance on the map. Importantly, the response phase reverses at the shared boundaries between adjacent areas (black arrows). C, Group polar angle phase plots are shown for both RH and LH (N = 2). Phase values within a given area were interpolated into a common space, which allowed for intersubject averaging. The blue and green dots indicate phase values for individual subjects after interpolation. The red line indicates the group average. The smooth progression of phase values within a given area and the phase reversals at area boundaries are apparent in the group averages as well as in the individual subjects.
