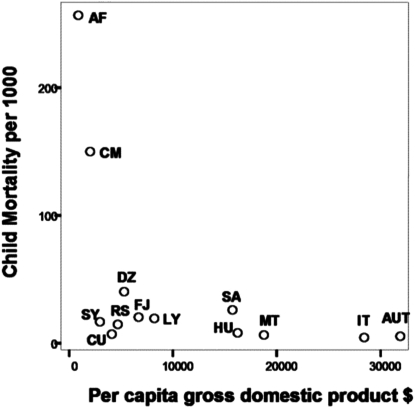
Figure 3.
National performance gap scatter plot showing children mortality in some chosen countries in relation to per-capita gross domestic product. [SY: Syria, SA: Saudi A, RS: Serbia, MT: Malta, LY: Libya, IT: Italy, HU: Hungry, FJ: Fiji, CU: Cuba, CM: Cameroon, UT: Australia, DZ: Algeria, AF: Afghanistan]. Higher mortality or intermediate mortality in spite of higher income depicts low performance systems

