
Figure 10.
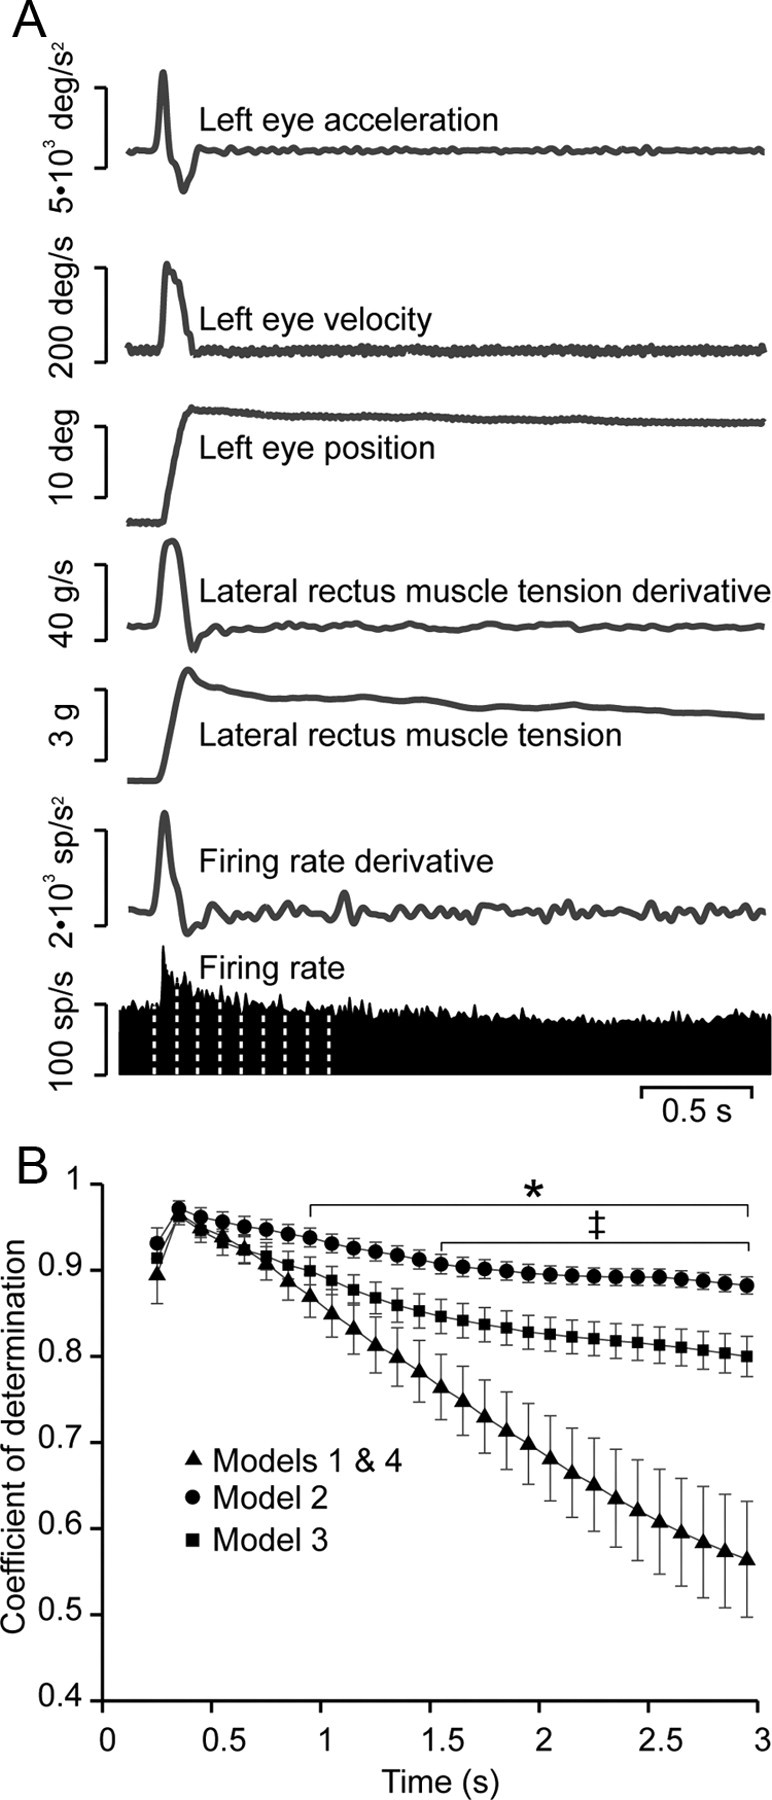
Statistical analysis of the models. The goodness of the prediction of each model, measured as the coefficient of determination obtained by multiple regression, was tested using epochs of increasing duration. A, Epochs started 200 ms before an on-directed saccade and lasted 3 s. The models were first tested on the initial 250 ms of the epoch and then on successive steps of 100 ms each. B, Coefficients of determination vs time for the different models. No differences were found between coefficients of determination from models 1 and 4. However, as the period used on the regression increases, the goodness of models 1 and 4 decreases to a greater extent than the coefficient of determination of models 2 and 3. One second after the time interval of analysis started, the goodness of the prediction made by models 1 and 4 was significantly different from that of model 2 (*p < 0.05, two-way ANOVA) and, 600 ms after, was also different from that of model 3 (‡p < 0.05, two-way ANOVA). No significant differences were found in the goodness of fit between models 2 and 3; however, the coefficient of determination values were always lower for the latter model.