
Figure 9.
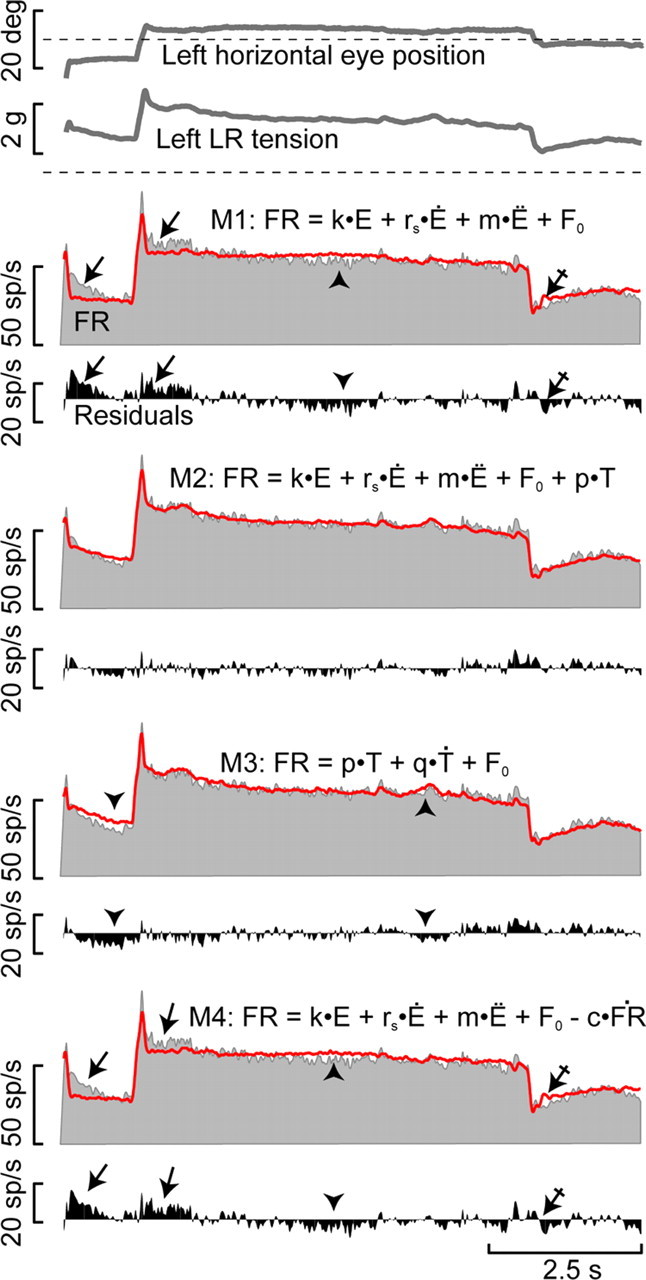
Models for the prediction of the activity of abducens motoneurons. From top to bottom, left horizontal eye position, lateral rectus muscle tension, and firing rate of an abducens motoneuron (FR, gray) during spontaneous eye movements are shown. The predicted firing rate for each model is shown (red line) on top of the original firing rate. Below each prediction the residuals, i.e., original minus predicted firing, are plotted. Model equations M1 through M4 are just above corresponding predictions. Note that model 1, based on eye movement signals (Van Gisbergen et al., 1981), as well as model 4, based on eye movement signals and the derivative of the firing rate (Robinson, 1964), do not predict effectively either the postsaccadic slide in both directions (activation, arrows; inactivation, crossed arrows) or the slow decay observed along the fixation (arrowheads). Estimations from models 2 and 3 that use tension (T) terms, on the other hand, are closer to the original discharge during postsaccadic slides, as is demonstrated by the small residuals in these regions. While model 2 includes eye movement parameters plus tension, model 3 only uses tension and its first derivative.