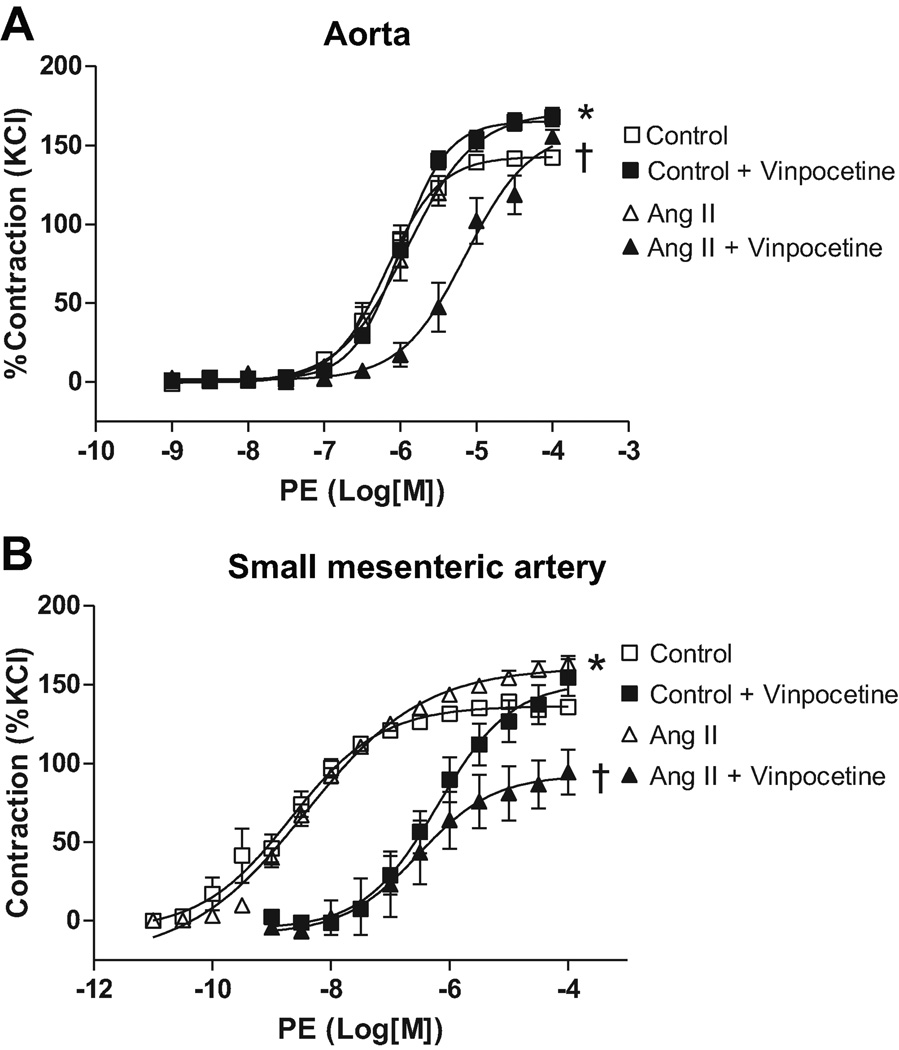
Figure 1. PDE-1 inhibition decreases vascular contraction in arteries from Ang II hypertensive, but not control, rats.
Concentration-response curves to PE were performed in (A) aorta and (B) small-mesenteric arteries from Ang II hypertensive (▲) and control (■) rats, in the absence (open symbols) or in the presence (filled symbols) of vinpocetine (10µM, 30 minutes). Data are mean ± SEM (n=6). Symbols represents the results from two-way ANOVA, and express differences in the Emax. * P<0.05 vs. control. † P<0.05 vs. Ang II.

