
Figure 1.
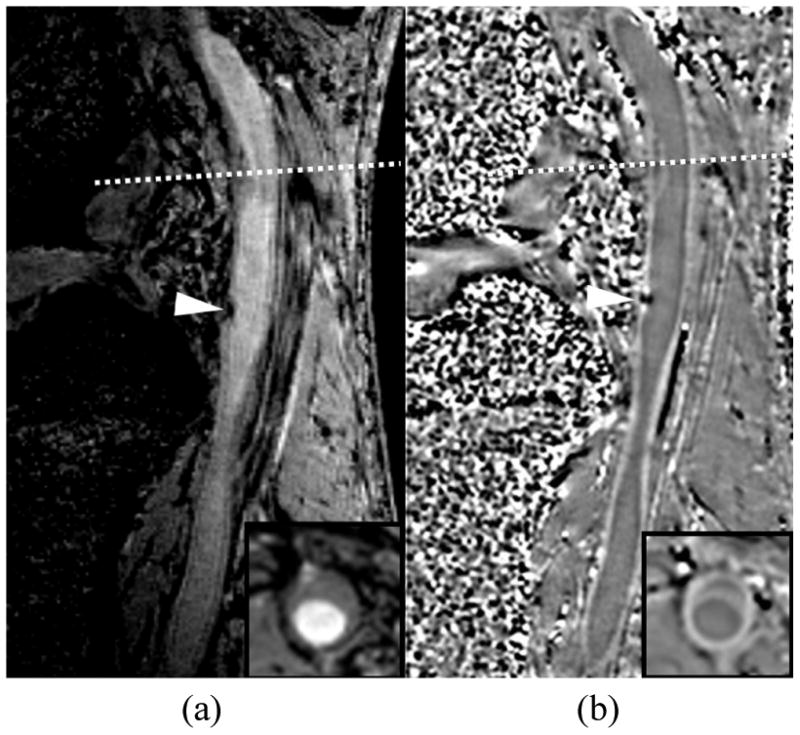
Susceptibility weighted image of a femoral artery showing a) the magnitude image and b) the phase image. Calcification (arrowhead) is dark on the magnitude image and causes a distinct phase difference on the phase image. The phase image also exhibits high wall contrast. The dotted line marks the location of the inset image.