
Figure 5.
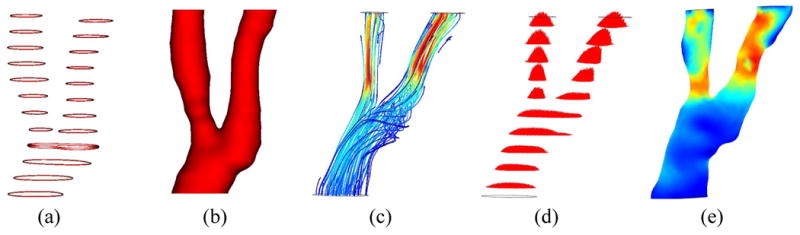
Illustration of computational fluid dynamics for assessment of wall shear stress showing a) lumen contours extracted from cross-sectional MRI, b) reconstructed lumen surface, c) estimated flow pattern depicted using streamlines, d) estimated flow profiles in each cross-section, e) resultant wall shear stress map. In the map, low shear stress is shown in blue and high stress is shown in red.