
Figure 6.
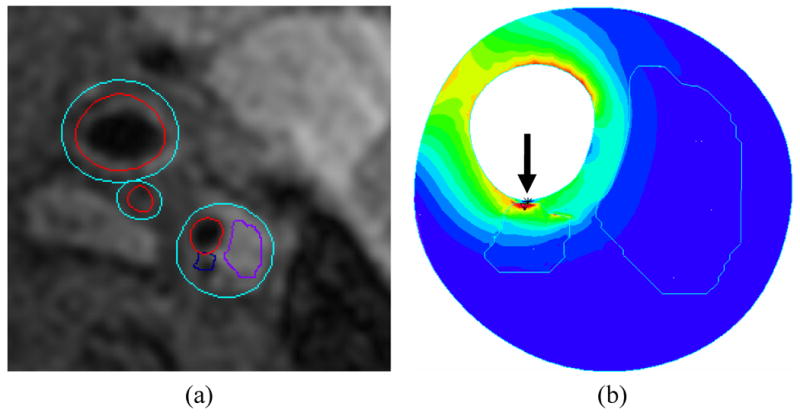
Illustration of fluid structure interaction model of a carotid plaque showing a) plaque regions extracted from cross sectional MRI and b) corresponding stress map within the wall. A high-stress region (arrow) is associated with a small juxtaluminal calcification. In the map, low stress is shown in blue and high stress is shown in red.