Fig. 1.
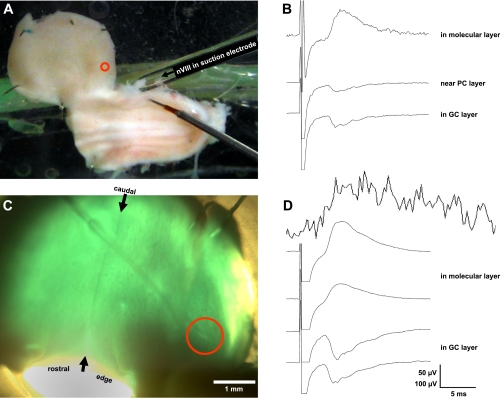
Turtle brainstem-cerebellum preparation maintained in vitro. A: photograph of an unstained preparation in the recording chamber viewed with ambient room illumination. Cerebellar cortex (Cb) is rotated away from the brainstem by cutting its left peduncle and pinning it ventricular side up to the Sylgard floor of the top shallow compartment of the chamber. Brainstem was pinned dorsal side up in the bottom, deeper compartment that also contains the ground wire. Thus the image shows the cerebellum's rostral edge down, yet the cut rostral edge of the brainstem is to the left. A pipette with a polished tip serves as a suction electrode to record from the right eighth cranial nerve (nVIII). Beneath the suction electrode is a tungsten bipolar stimulating electrode directed towards the vestibular nucleus (data not shown). Entering the cerebellum at the center of the red circle is a ∼100 KΩ glass micropipette that is not visible (but see C). B: traces of cerebellar field potentials recorded through a ∼100 KΩ glass micropipette (not visible) at three depths as it was advanced from the ventricular surface. Average voltage traces are shown vertically offset, in response to twenty 100-μs, 100-μA pulses, at a shallow, intermediate, and deep position, roughly corresponding to the granule cell (GC) layer, near the Purkinje cell (PC) layer and the molecular layer (ML). C: cerebellar cortical preparation (different from A) was stained with the voltage-sensitive dye RH482, transilluminated, and photographed through the ×2 objective of the microscope. Midline raphe is observed connecting the rostral and caudal midpoints (see arrows). The shank of the glass micropipette can be seen entering the cerebellum yet its tip is no longer visible within the red circle. D: like B, traces of field potentials are shown for 4 Cb depths as it was advanced from the ventricular side of the cerebellum. Note the clear stimulus artifact. Above those traces is a trace without a stimulus artifact measured by optical diodes imaging the Cb within the red circle. Unlike the averaged, filtered voltage trace (3 dB below 1 KHz), the optical response is not filtered. Its response shows no artifact and presumably represents absorbance changes from the entire tissue depth. Although this optical recording is quite noisy, its onset and peak timing are similar to the voltage traces recorded by the pipette (voltage calibration: 50 μV for B and 100 μV for D).

