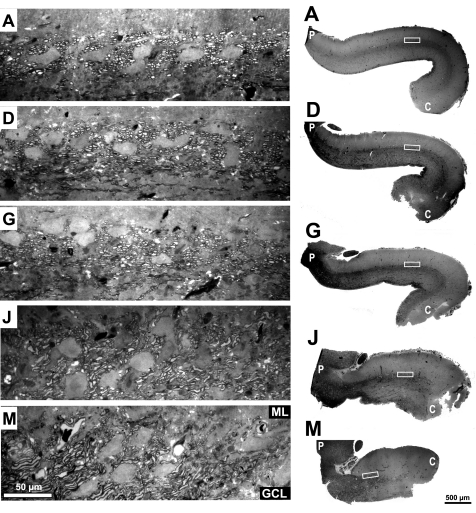
Fig. 12.
Photographs of 5 sagittal 1 μm sections (A, D, G, J, and M; representing 0, 20, 40, 60, and 80% of the distance from the midline to the lateral edge of the cerebellum, respectively). Right: low-power photographs with boxes indicating the location of the high-power photographs at left. High-power photographs have the same magnification as those in Fig. 11. Epoxy-embedded sections stained with toluidine blue.

