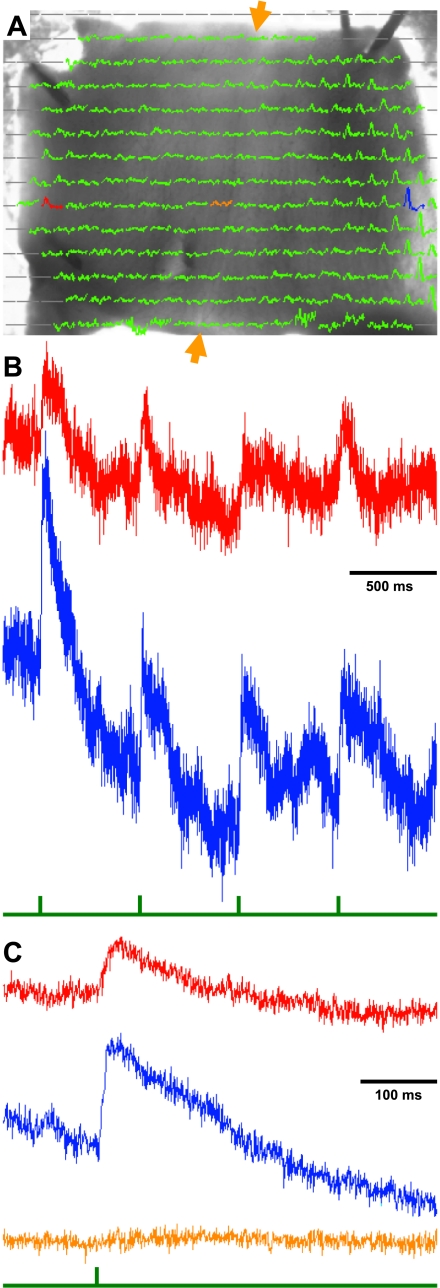
Fig. 2.
Analysis of cerebellar responses to single nVIII current pulses. A: traces recorded by the photodiode array, superimposed on the monochrome image of the ventricular surface of a transilluminated turtle Cb in the recording chamber (as in Fig. 1C). Gray lines indicate diodes that did not image the transilluminated tissue. The remaining 245-ms traces represent responses to a single 150-μA current pulse to the right nVIII. Red, blue, and tan traces show responses from diodes on the contralateral Cb edge, on the ipsilateral Cb edge, and at the Cb midline, respectively. B: raw traces from diodes in the 2 Cb edges. Without any filtering, these traces occasionally show slow drifts of their baseline, upon which responses occur to the standard stimuli of 4 pulses (interval of 575 ms, sampled at 1.6 KHz). Below the traces is a green stimulus pulse that indicates the current pulse. Note that responses follow each stimulus with a short latency and are larger than the noise even without averaging. C: averages of responses from the four pulses indicate that responses on both sides of the Cb exhibit a similar latency. There is no response (tan trace) from the diode between the 2 responsive edges along the midline (between the tan arrows).

