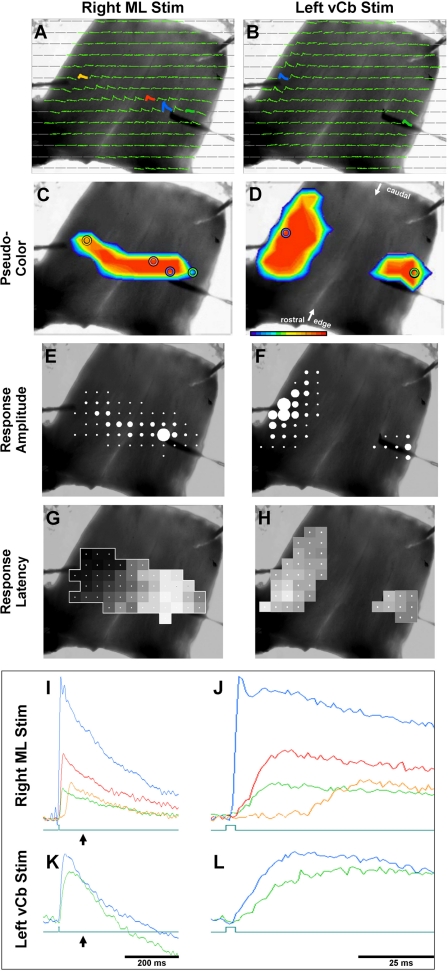
Fig. 5.
Comparison of transverse conduction timing differences of responses to 100-μA pulses into medial ML (A, C, E, and G) and into lateral edge (vCb; B, D, F, and H). A bipolar microelectrode was place either in the ML of the medial Cb (blue trace in A, I, and J) or in the vCb (blue trace in B, K, and L). Colored circles in C and D correspond to colored traces in A and B. ML microstimulation evoked a depolarization along a transverse parallel fiber beam. I and J: traces of 4 diodes in A are superimposed in I and expanded in time in J. Blue trace responses began immediately following the 100-μs stimulus pulse. Red and green responses, the diode locations of which straddle that of the stimulus, responded with approximately the same onset latency (∼3.8 ms). Orange trace response, the diode of which was located near the end of the transverse beam, responded much later (27 ms). Note that the ML response is bilateral, yet its response along the Cb lateral edge is limited. C–H: responses superimposed on monochrome plots. C and D: pseudocolor frames. E and F: relative response amplitude of each diode (dot-amplitude array, see methods). G and H: relative response latency of each diode (latency-distance plot: white is zero latency and black is maximal latency; see methods). B, D, F, and H: vCb microstimulation evoked an ipsilateral response that spread sagittally and a contralateral response that was more localized. Traces of a diode in each response field are superimposed in K and expanded in time in L. Blue and green responses, the diode locations of which in B were more distant than that of the green and orange diodes of A, had very similar latencies. Green pulses below the traces indicate the onset of the 100-μs stimulus. Arrows below the traces in I and K indicate the point in time shown in the pseudocolor frames C and D.

