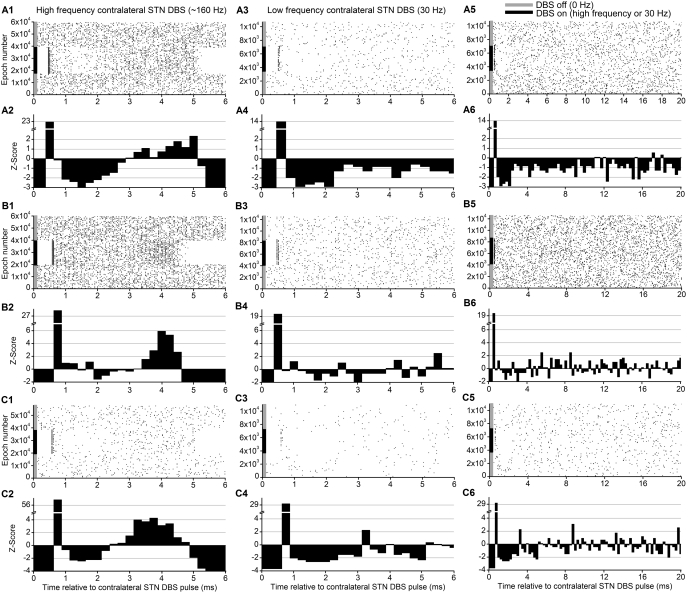
Fig. 4.
A–C: discrete rasters and Z-score-adjusted histograms of 160 Hz and 30 Hz contralateral STN DBS in representative neurons from 3 different subjects undergoing staged STN DBS for PD. In contrast to Fig. 3, 120 s of contralateral STN DBS (gray bar) are straddled by 120-s epochs of resting STN activity with DBS off (solid bars). Z-score-adjusted histograms compare the prestimulus baseline activity to the activity during continuous 160 Hz and 30 Hz frequency stimulation showing significant changes in STN activity temporally related to the delivery of the contralateral stimulus. In addition to the short latency responses described previously in Fig. 3, there is an increase in activity at a latency of ∼3.5–5 ms after the stimulus pulse during 160 Hz stimulation but not during 30 Hz stimulation over the same time interval (A2, B2, and C2 vs. A4, B4, and C4). A5, B5, and C5 and their accompanying Z-score-adjusted histograms contain the same data as that displayed in A3, B3, and C3, except that the response to 30 Hz stimulation is shown over a longer time window.

