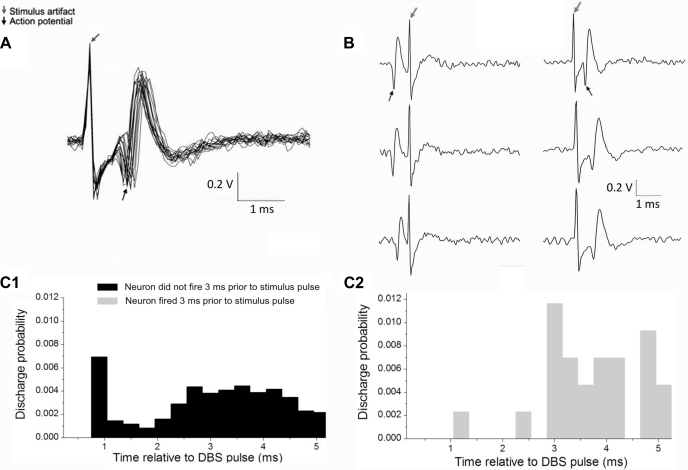
Fig. 5.
A: analog raster showing consecutive occurrences of the same neuron in the condition where the discharge follows the high frequency contralateral STN stimulus within 1 ms of the stimulus pulse. The analog data contains the stimulus artifact (black arrows). B: the first column shows epochs of the analog data with neuronal action potentials occurring immediately before the contralateral stimulation pulse with no subsequent short latency discharge after the stimulation pulse. The second column displays epochs of the analog data in which the stimulus pulse is followed by a short latency neuronal discharge and not preceded by an action potential. C1 and C2: collision analysis compares the probability of a discharge of the neuron when it does not discharge within 3 ms before the stimulus pulse vs. when it does discharge within 3 ms before the stimulus pulse. The probability of a short latency action potential is decreased immediately after the stimulation pulse only when the stimulus pulse is preceded by a spontaneous discharge of the neuron.

