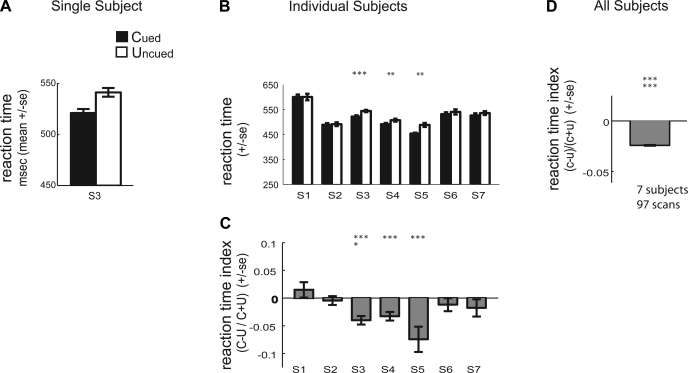
Fig. 3.
Psychophysical performance during scanning: reaction time. A: plot of the mean reaction time (±SE) for subject S3 for the cued attention condition (first and second translation of the same dot field) and the uncued attention condition (first and second translation of different dot fields). B: plot of the mean reaction time for the cued and uncued condition for each of the 7 subjects (S1–S7). We computed an attention index, (C + U)/(C − U), to normalize for differences in the absolute magnitude of the attention effect across subjects. C: plot of the average reaction time attention index for each subject (±SE across scans). D: plot of the average reaction time attention index across subjects (±SE across all subjects, all repeats). *P < 0.05; **P < 0.01; ***P < 0.005 (2-tailed paired Wilcoxon signed rank test for B and 2-tailed Wilcoxon signed rank test for C and D).

