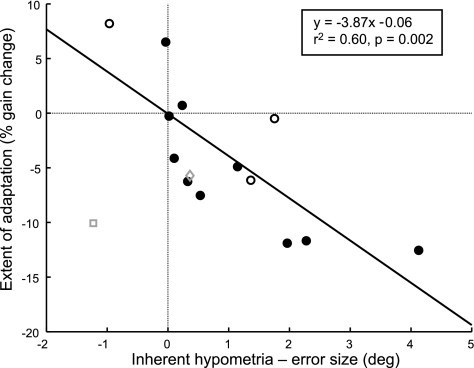
Fig. 5.
Relationship between the extent of adaptation and the difference between inherent hypometria and presented error size. Hypometria was measured as the difference between the requested saccade size (20°) and the average preadaptation primary saccade amplitude. The difference between hypometria and error size is related to adaptation: when hypometria exceeds the presented error, saccade gain decreases, and vice versa as expected (n = 12; 14 sessions). Data were included from subjects who experienced the 0.7° constant error (●) as well as the 3 sessions in the pilot study (○). One subject (□) made hypermetric and hypometric saccades in an inconsistent fashion; when the average of only the hypometric saccades was measured (◊), his data agreed with that of the other 11 subjects (r2 = 0.57, P = 0.002). Nevertheless, this subject was excluded from the linear regression (solid line; r2 = 0.60, P = 0.002) because the nature of his expectation of inherent hypometria was unclear.

