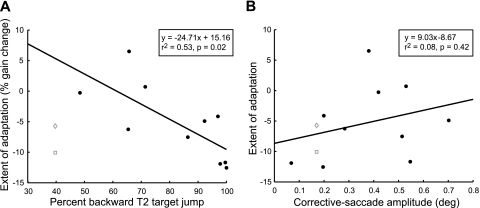
Fig. 6.
Correlation of various parameters to the measured extent of adaptation for all subjects in the main experiment (0.7° constant error). A: correlation of achieved adaptation to the percentage of times T2 jumped in the backward direction. Correlation is significant (r2 = 0.53, P = 0.02), but a stepwise linear correlation excludes this regression in favor of the regression presented in Fig. 5. B: no correlation to the average corrective saccade amplitude (r2 = 0.08, P = 0.42), which agrees with previous studies suggesting that the corrective saccade is not necessary for adaptation. For both plots, data from subject K are displayed with all preadaptation saccades included (□) and with only hypometric preadaptation saccades analyzed (◊). As before, these data have been excluded from the correlation analyses; including either possible data point decreases the measured correlations to nonsignificant levels.

