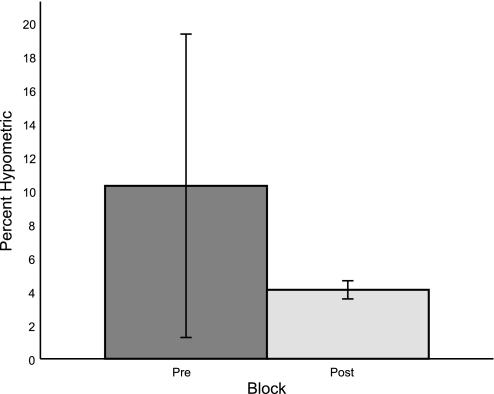
Fig. 7.
Comparison of the size of hypometria relative to that of the primary saccade before (Pre) and after (Post) adaptation. Values are means ± SD. Preadaptation, each subject's inherent hypometria was divided by their average primary saccade size prior to adaptation. Postadaptation, the presented visual error of 0.7° was divided by the average adapted saccade amplitude. The mean percentage of hypometria is significantly different before and after adaptation (rank sum test, P = 0.03), as is the variance pre- compared with postadaptation (F-test, P = 0.000).

