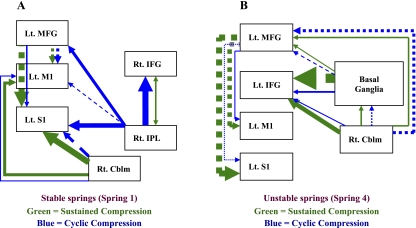
Fig. 4.
Diagrams of the connectivity models (SEM models) for sustained and cyclic compressions. The arrows represent the weighting of the point estimates (PE) and direction of correlation between brain regions. Other anatomically relevant brain regional connections were used to fit the models (i.e., other brain areas are active in both tasks); only the major significant differences between compression tasks are shown. Solid lines represent positive correlation; dashed lines represent negative correlations. Green = sustained compression; blue = cyclic compression.  . Rt, right; Lt, left; Cblm, cerebellum; IFG, inferior frontal gyrus; IPL, inferior parietal lobule.

