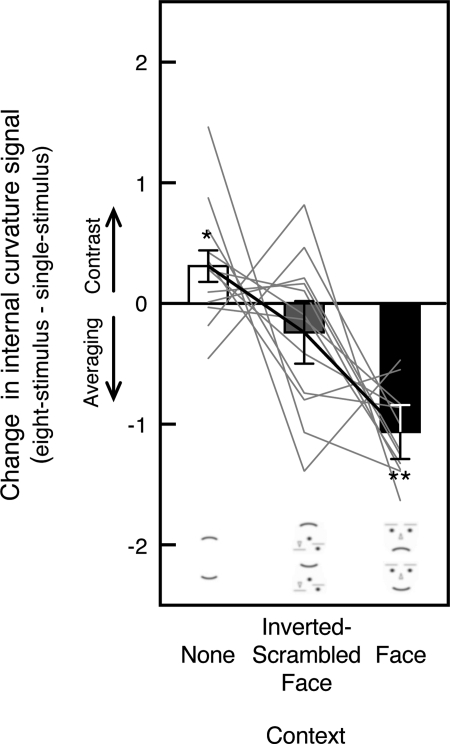
Fig. 10.
Feature contrast in the no-context condition and feature averaging in the face-context condition. The bar graphs show the difference in estimated internal curvature signals between 8-stimulus and single-stimulus curvature-present trials for the 3 stimulus conditions. Positive values indicate feature contrast, and negative values indicate feature averaging. For the no-context condition, the presence of straight segments (on 8-stimulus trials) increased curvature signal from the curved segment compared with when the curved segment was presented alone (on single-stimulus trials), feature contrast (the left bar). For the face-context condition, the presence of straight segments reduced curvature signal from the curved segment, feature averaging (the right bar). The line graphs show individual observers' data with each observer's overall mean aligned to the group mean to show the consistent condition effects unobscured by the baseline individual differences. The error bars represent ±1 SE. **P < 0.01 and *P < 0.05 for deviations from 0 (no change in internal curvature signal due to spatial interaction).

