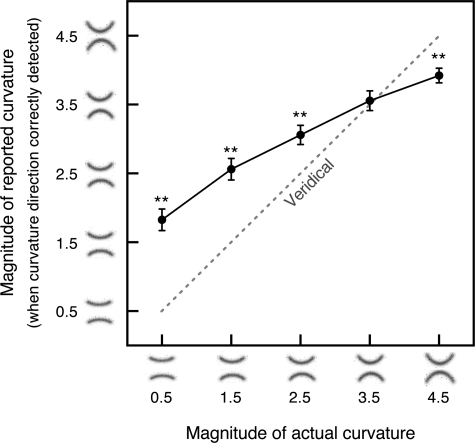
Fig. 11.
Magnitude of reported curvature as a function of the actual curvature of a curved segment presented among straight segments in the no-context condition when curvature direction was correctly reported. The data are collapsed across the upward and downward curvature directions. Values above the dotted line indicate perceptual exaggeration, and values below the dotted line indicate underestimation. The error bars represent ±1 SE. **P < 0.01 for deviations from veridical curvature magnitudes (dashed line).

