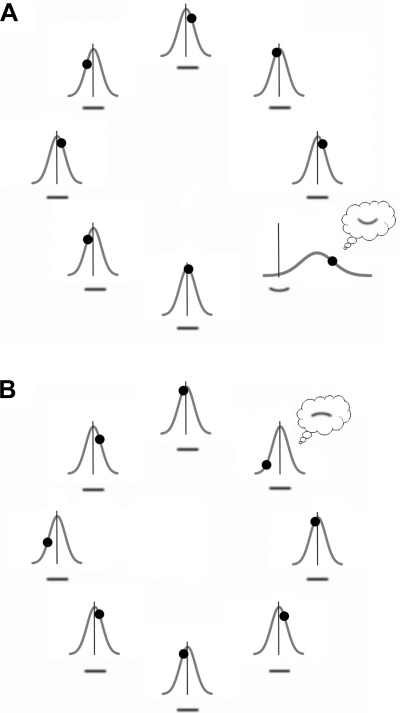
Fig. 3.
Gaussian probability distributions of local curvature-channel population outputs with their means (peaks) indicating average curvature signals and standard deviations (widths) indicating average noise magnitudes used in our model to simulate curvature search. On each simulated curvature-search trial, these populations produce randomly sampled outputs (indicated by filled circles) in parallel, and the observer selects the channel population yielding the largest curvature output and reports that value; in the illustration, the observer selects the population for which the filled circle is most deviated from null curvature (indicated by the vertical lines). A: example of a curvature-present trial (from the no-context condition in experiment 1). The Gaussian mean is shifted for the channel population responding to the upward-curved segment due to curvature signal; the Gaussian means are virtually 0 for all other local channel populations responding to the straight segments (indicating little perceptual bias). In this example, the channel population responding to the curved segment produced the largest output (indicated by the circle shifted farthest away from null curvature represented by the vertical line). A response error occurs when the largest curvature output happens to be generated (due to noise) in the opposite direction by a channel population responding to a straight segment. B: example of a curvature-absent trial. The Gaussian means are near 0 for all channel populations because all stimuli are straight and there is little coding bias. The channel population most strongly perturbed by curvature noise leads the observer to report a downward-curved segment of the corresponding curvature. Note that in these illustrations, the Gaussian channel-output distributions have been drawn in proportion to the estimates of average curvature signal and noise obtained in experiment 1.

