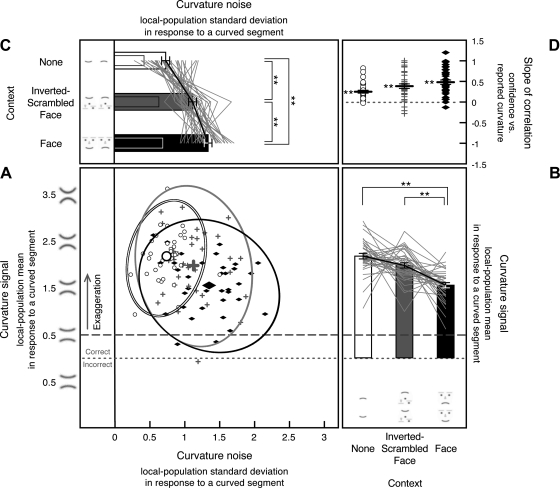
Fig. 5.
Internal curvature signal (i.e., the Gaussian mean of the curvature-channel population output) and noise (i.e., the Gaussian standard deviation of the channel-population output) in response to a curved segment estimated from 8-stimulus curvature-present trials in experiment 1, shown along with the slopes for the correlation between reported curvature and confidence. A: scatterplot showing each observer's internal curvature noise (x-axis) and curvature signal (y-axis) from each condition, with open circles showing estimates for the no-context condition, gray plus symbols showing estimates for the inverted-scrambled-face condition, and filled black diamonds showing estimates for the face-context condition, with corresponding 95% confidence ellipses. Estimates of curvature signal are collapsed across trials containing an upward-curved segment and those containing a downward-curved segment so that the values on the y-axis reflect the absolute magnitude of reported curvature independent of direction (see methods for experiment 1). Estimates of internal curvature signal above the dotted line indicate correct encoding of curvature direction, and those below the dotted line indicate incorrect encoding of curvature direction. Estimates of internal curvature signal above the dashed line (the veridical curvature magnitude) indicate exaggeration. As in Fig. 4, the scatterplot shows data for all observers, but it obscures the consistent effects of stimulus conditions on the magnitudes of curvature signal and noise because of the relatively large individual differences in the baseline levels of internal curvature signal and noise. B: the y-dimension of the scatterplot (estimated internal curvature signal) presented as a line graph per observer with each observer's overall mean aligned to the group mean to show the consistent condition effects. The accompanying bar graphs show the group means with the error bars representing ±1 SE (adjusted for repeated-measures comparisons). C: the x-dimension of the scatterplot (estimated internal curvature noise) presented as a line graph per observer with each observer's overall mean aligned to the group mean to show the consistent condition effects. The accompanying bar graphs show the group means with the error bars representing ±1 SE (adjusted for repeated-measures comparisons). The internal curvature noise in response to a straight segment (reproduced from Fig. 4C) is shown for comparison as overlapping narrow bars. D: slope of the correlation between reported curvature and confidence shown for each observer for each stimulus condition (note that incidences of similar slopes produced overlapping symbols, giving the impression of missing data). The black horizontal bars indicate the mean slope with the error bars representing ±1 SE. For A–D, **P < 0.01.

