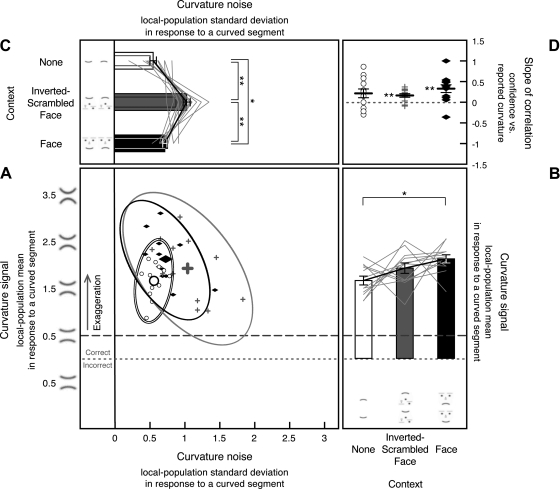
Fig. 9.
Internal curvature signal (i.e., the Gaussian mean of the curvature-channel population output) and noise (i.e., the Gaussian standard deviation of the channel-population output) in response to a curved segment estimated from single-stimulus curvature-present trials in experiment 2, shown along with the slopes for the correlation between reported curvature and confidence. The formats and labels are identical to those in Figs. 5 and 7, which present similar data for 8-stimulus trials. For A–D, **P < 0.01, and *P < 0.05.

