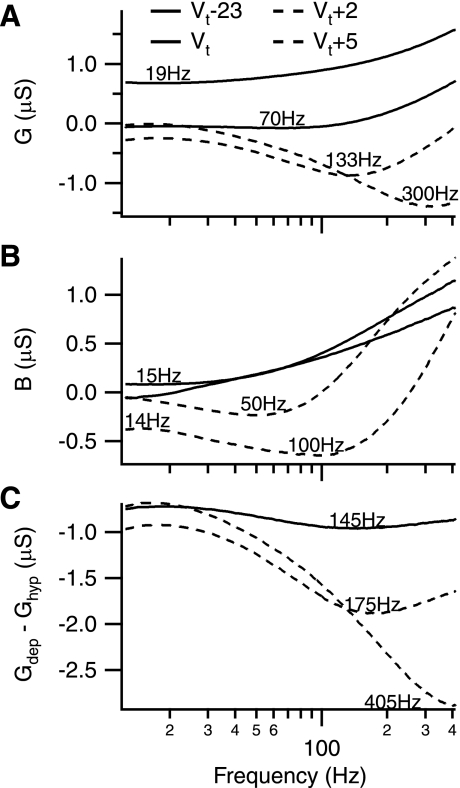
Fig. 2.
Model predictions. The conductance (G) and the susceptance (B) aspects of the frequency-sweep response of the model are shown for several holding potentials [−23 mV, 0 mV, +2 mV, and +5 mV relative to threshold (Vt)]. Solid and dashed lines indicate subthreshold and threshold/suprathreshold holding potentials, respectively. Values indicate the frequency of the negative peak in curve. A: G decreases with depolarization, an effect that becomes more pronounced at higher frequencies. Note the progressive flattening of the frequency response as threshold is approached (compare the −23-mV trace with the 0-mV trace). B: B generally decreases with depolarization as well and also undergoes an increase of curvature. Although the hyperpolarized response is quite linear, the subthreshold (0 mV) response increases at the extrema of the frequency range and remains linear in the 30- to 80-Hz region. C: the active portion of G is obtained by subtracting the passive, hyperpolarized conductance (Ghyp) from the depolarized frequency responses (Gdep). As with the former case, the active portion generally decreases upon depolarization with the minima becoming more pronounced and progressively shifted to higher frequencies.

