Figure 6.
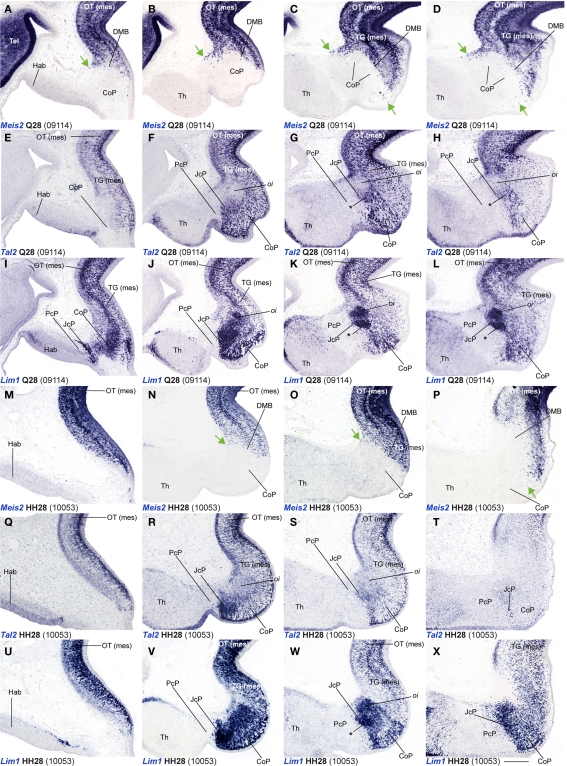
(A–X) Comparisons of in situ hybridization data for three markers labeling JcP and CoP at Q28/HH28 in horizontal cryostat sections at four section levels (in each case a single specimen). The markers are identified at the bottom left corner of each panel. Each row of panels [e.g., (A–D)] shows from left to right four section levels (dorsal to ventral sequence) reacted for a particular marker. The first three rows show different markers in the quail, and the last three rows contain comparable material for the chick, so that panels taken long the vertical columns represent essentially the same section level and are comparable across the species. Green arrows in (A–D,N–P) indicate apparently ectopic cells expressing Meis2 (midbrain marker) at the CoP su and pe strata. Asterisks in (G,H,K,L,W) identify the developing lateral spiriform nucleus, exhibiting high expression levels of Lim1 and a low Tal2 signal. Numbers between brackets: code of the specimen in our collection. Scale bar = 300 μm.

