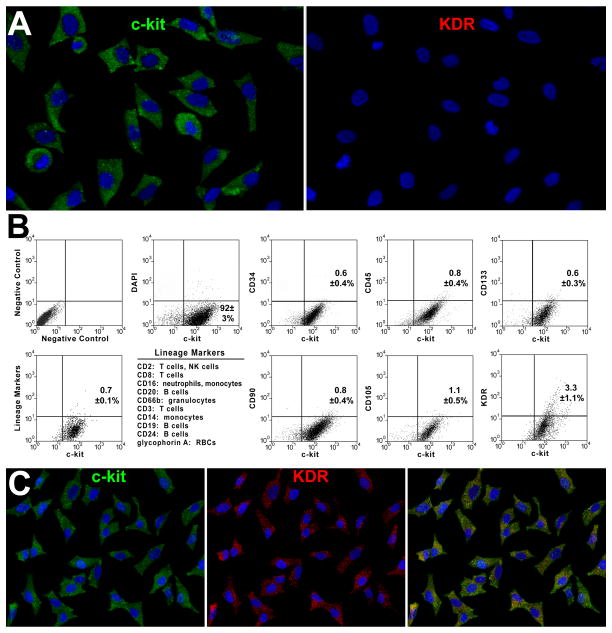
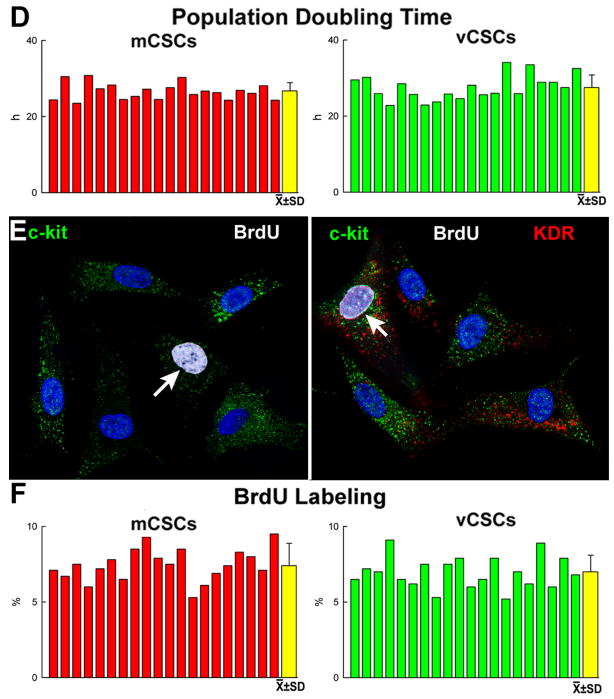
Figure 1. Isolation and expansion of mCSCs and vCSCs.
A, Sorted c-kit-positive (left, green) KDR-negative (right) cells in culture. B, Bivariate distribution of c-kit, markers of hematopoietic cells (CD34, CD45, CD133, cocktail of bone marrow cell lineages), mesenchymal cells (CD90, CD105), and KDR. C, Sorted c-kit-positive (left) KDR-positive (central, red) in culture. Right panel, merge. D, PDT in mCSCs and vCSCs: individual and average values. E, mCSCs and vCSCs labeled by BrdU (white, arrows). F, Percentage of BrdU-labeled mCSCs and vCSCs.


