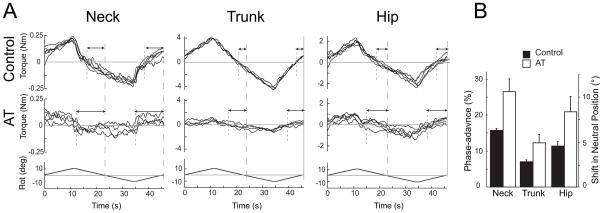
Figure 3.
A) Representative phase-advance at each level for AT teachers and control subjects. Each graph represents a single trial with cycles overlaid. Torque zero-crossing is indicated by short-dashed lines; platform zero-crossing by long-dashed lines. Arrows depict phase-advance. Control traces: phase-advance for the neck=14.5%, trunk=5.3% and hip=7.7%; AT traces: phase-advance for neck=24.0%, trunk=12.0% and hip=10.2%, and. B) Mean phase-advance at each level for AT teachers and control subjects (±SEM). The left axis indicates the advance as a % of the full 40s, while the right axis indicates the corresponding shift in the torque-neutral position from the central platform position per half cycle (i.e., the platform angular displacement at zero-torque).

