Figure 1.
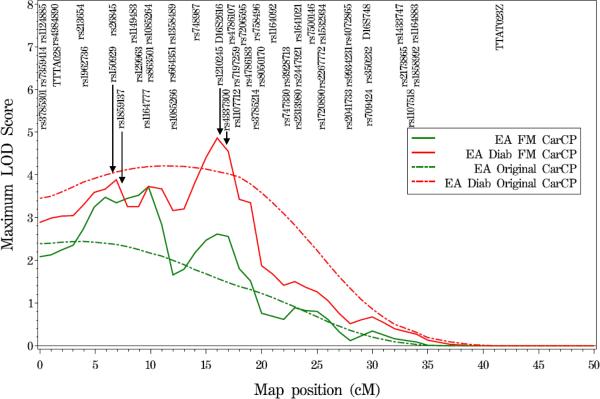
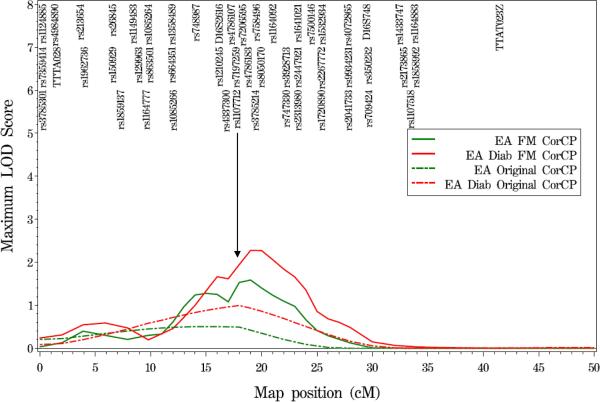
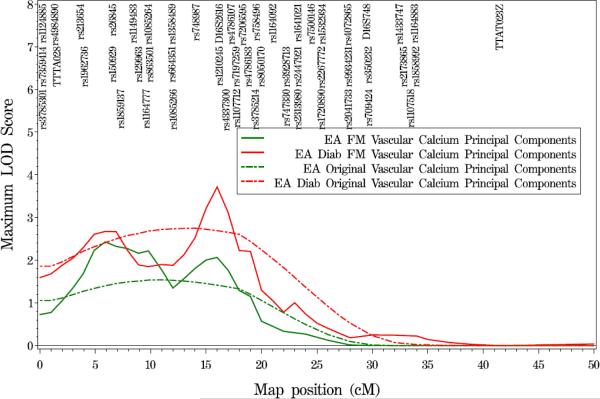
Variance components QTL linkage analysis of chromosome 16 in EA families and EA T2DM-affected individuals. Results shown here reflect the linkage signals observed before and after fine-mapping. Broken lines represent results from the original genome scan, while solid lines represent the results from fine-mapping. To optimize legibility, not fine-mapping analyses SNPs are displayed on the figures.
(A) carotid artery calcified plaque (CarCP)
(B) coronary artery calcified plaque (CorCP)
(C) vascular calcified plaque principal component


