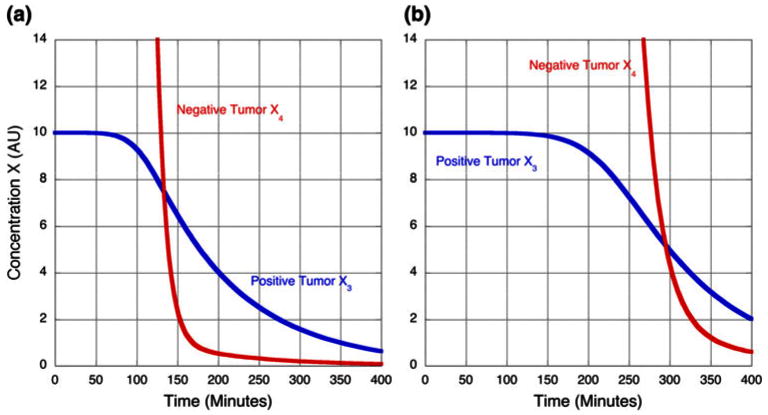
FIGURE 11.

Time course for the concentration of peptide bound to specific and non-specific targets associated with positive and negative tumors. (a) Discrimination with the nominal concentration of non-specific targets (T4 = 1.5 × 10⁶). (b) Discrimination with twice the nominal concentration of non-specific targets (T4 = 3.0 × 10⁶). See text for discussion.
