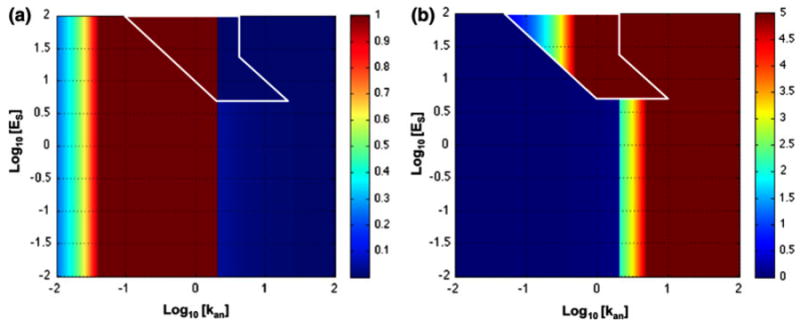
FIGURE 15.

Steady-state values of protrusion rate and stable adhesions from the deterministic model. (a) Protrusion rate, v, and (b) stable adhesions, s, represented as a heat map on the z-axis of the system design space. In the region of overlapping cases, the values are plotted for the steady state with the largest values. See legend of Fig. 13 for details.
