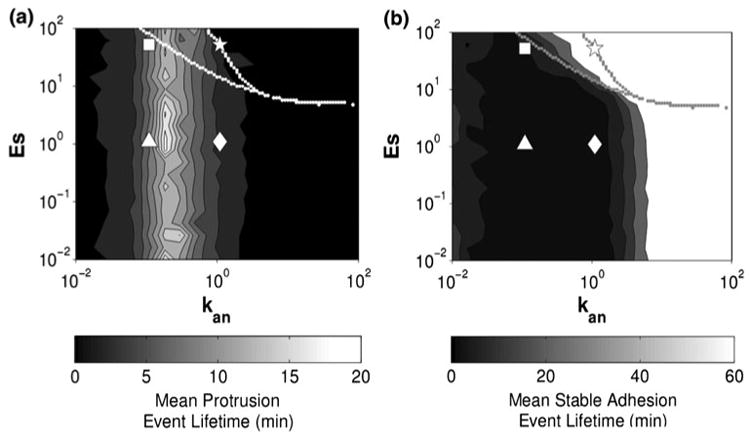
FIGURE 16.

Mean lifetimes of protrusion and stable adhesion events from the stochastic model.30 (a) Protrusion, v, and (b) stable adhesions, s, represented as a heat map on the z-axis. At high density of ECM (kan = 1) and myosin-mediated maturation of adhesions (Es = 50), sustained stable adhesions were observed with only rare transient protrusions. The dashed lines represent the region of hysteretic behavior as revealed by bifurcation analysis. From Welf and Haugh (personal communication).
