
FIGURE 4.
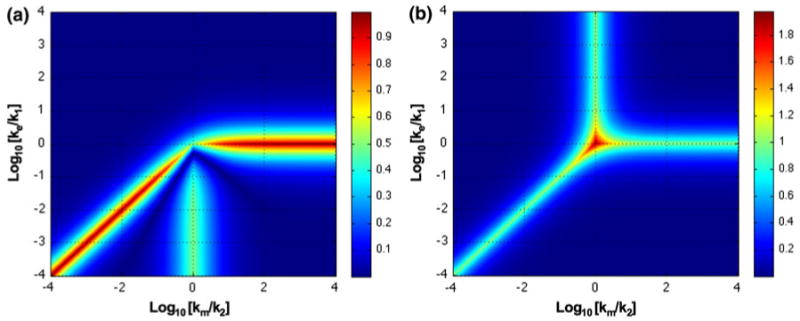
Accuracy of representation within system design space for the model in Fig. 1. (a) X1 and (b) X2. Differences between the values determined by the analytic solution and by the approximate solution within each phenotypic region are shown as a heat map on the z-axis. Error is measured as fold difference relative to the actual value. See text for discussion.