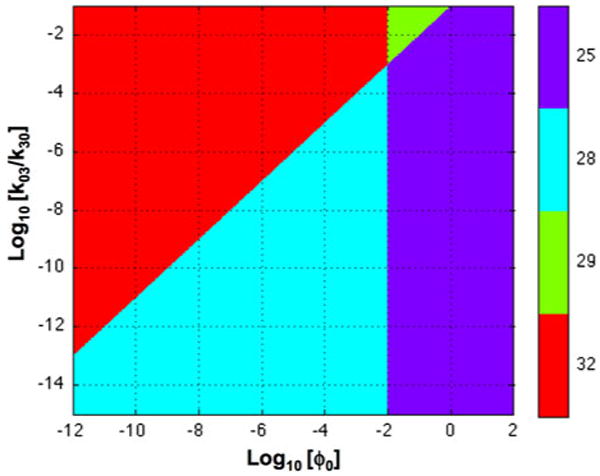
FIGURE 8.

System design space for the system in Fig. 7. The x-axis represents the various levels of peptide input, ϕo, and the y-axis represents the equilibrium dissociation constant for binding to the positive tumor, k03/k30. The nominal values of the parameters in arbitrary units are assumed to be the following: k12 = k21 = k15 = k51 = 1300, V1 = 104, V2 = 103, V3 = V4 = 10, V5 = 104, V6 = 103, T3 = 10, T4 = T6 = 1.5 × 10⁶, k30 = k40 = k60 = 1, k03 = 10−8, k04 = k06 = 10−3, km2 = km5 = 10−9, ke1 = 105, and ϕ0 = 10−5. The numbering of the regions and the corresponding color are indicated in the sidebar. The plot was generated by using the Design Space Toolbox.9
