
FIGURE 9.
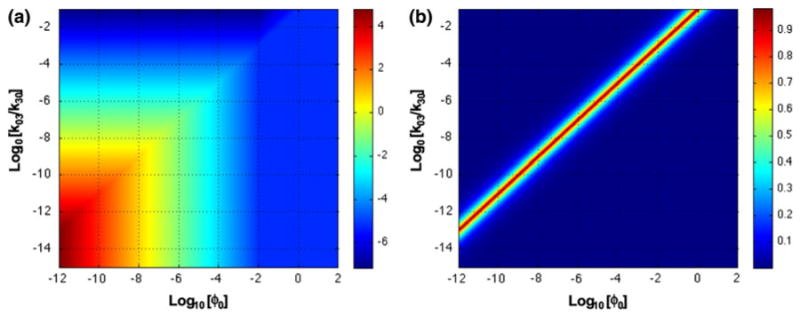
Discrimination and accuracy in system design space. (a) Discrimination between peptide bound to positive and negative tumors. The function Log10(V3X3/(V4X4)) is plotted as a heat map on the z-axis. Red corresponds to high discrimination and blue to low. (b) Accuracy of X3 determined from design space analysis. The function |X3,Approx − X3,Actual|/X3,Actual is plotted as a heat map on the z-axis. See legend for Fig. 8.