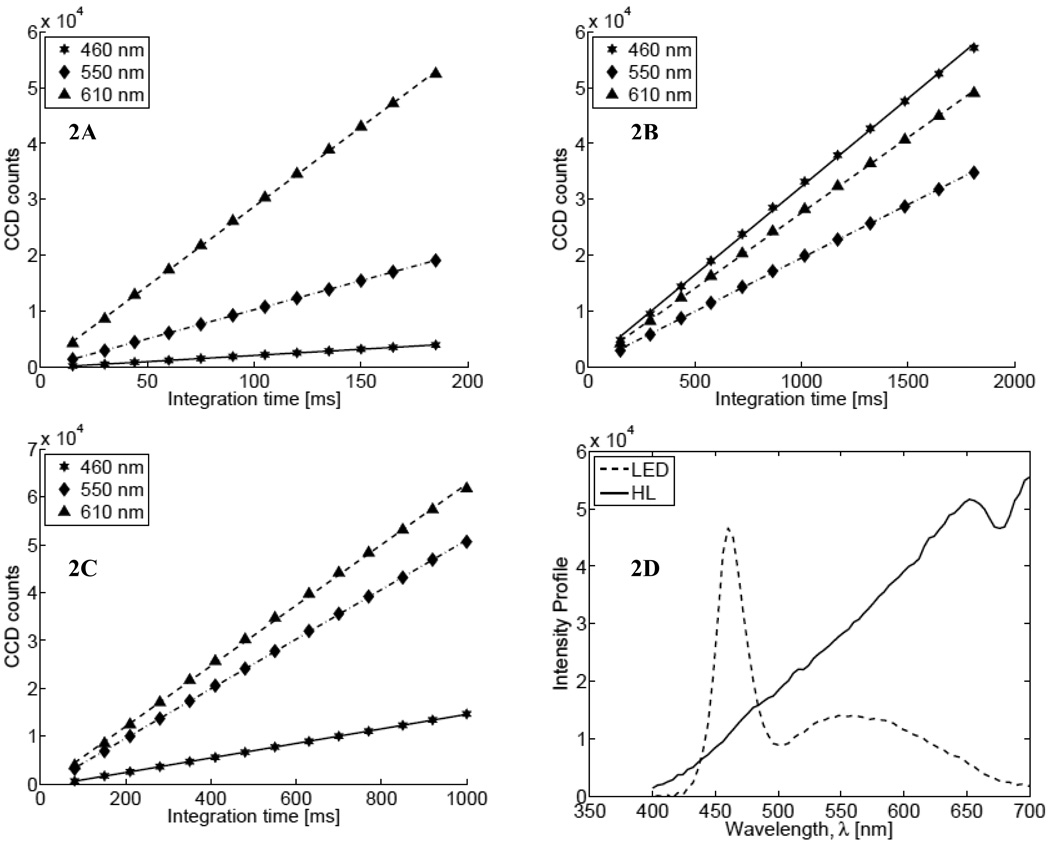
Fig. 2.
Linearity of lamp intensity for (A) System 1 (USB+HL), (B) System 2 (USB+LED), and (C) System 3 (Ava+HL) with different integration times. In each plot, stars, diamonds and triangles represent data at 460 nm, 550 nm, and at 610 nm, respectively. (D) The spectral profile of the two light sources (dashed line: LED; solid line: halogen).

