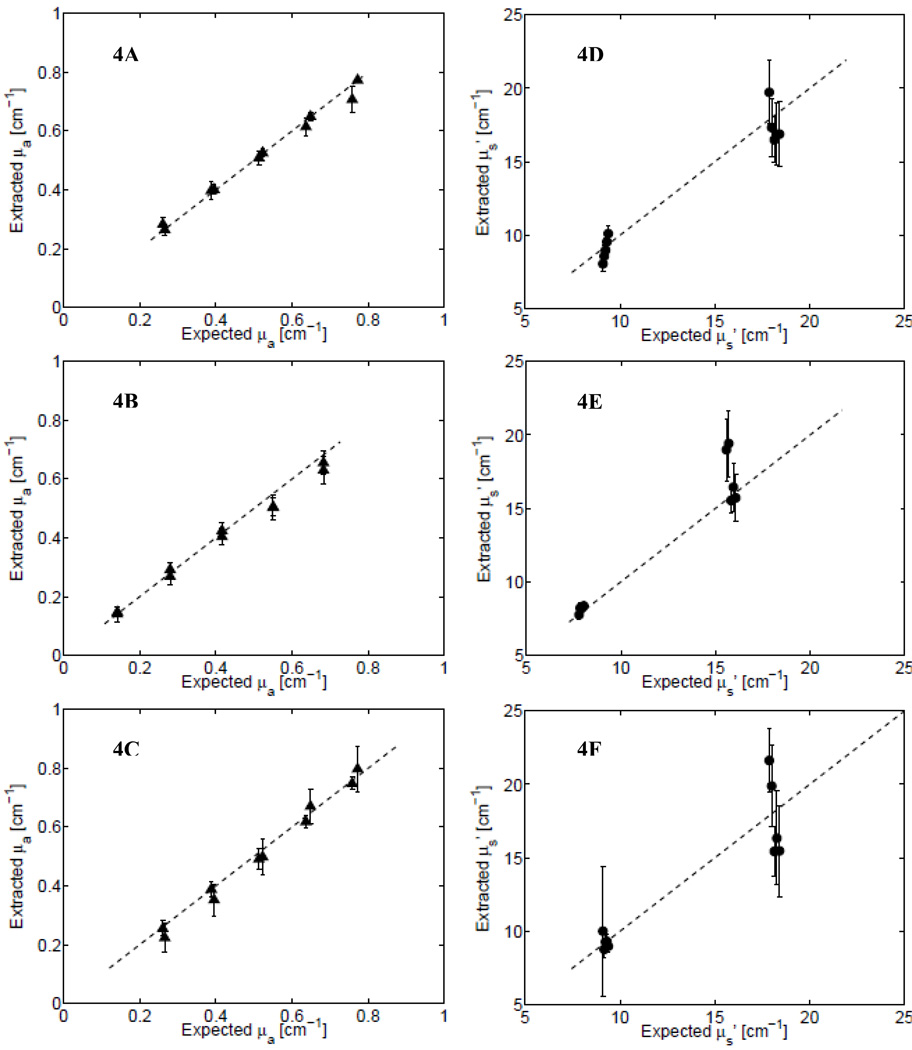
Fig. 4.
Extracted vs. expected values of the absorption coefficient and scattering coefficients from measurements using Systems 1–3 on phantom Set 3. (A) Absorption (triangles) and (D) scattering (circles), respectively, for System 1; (B) absorption and (E) scattering for System 2; and (C) absorption and (F) scattering for System 3. The dashed lines shows the ideal-fit line (y = x).

