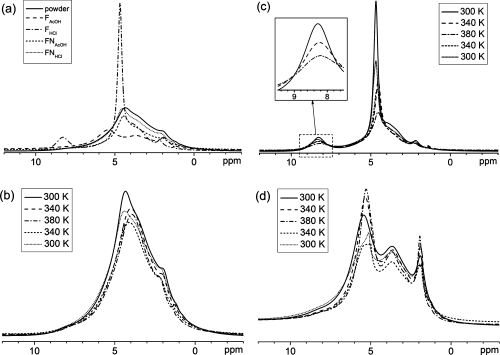
Figure 3.
1H MAS NMR spectra of various samples at 300 K (a), temperature-dependent 1H MAS NMR spectra recorded for the powder (b), FHCl (c), and FAcOH (d). For temperature-dependent spectra, the spectra were acquired in the order of the legend (top to bottom). The insert in (c) shows a zoom in the NH3+ signals recorded upon heating.

