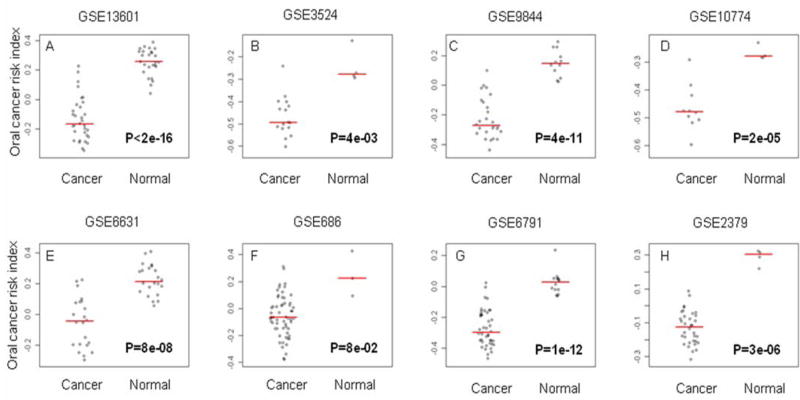
Figure 3.
Oral cancer risk index in head and neck cancers. Samples under comparison are head and neck squamous cell carcinoma (HNSCC) versus normal mucosa in both human tumors (A–C, E–H) and head and neck cell lines (D). The oral cancer index was computed as the average level of expression of the transcripts associated with a hazard ratio > 1 minus the average level of expression of the transcripts that have a hazard ratio < 1. Panels A–C compared HNSCC and normal mucosa from the oral cavity. Panels E–G compared HNSCC and normal mucosa from various anatomic locations. Panel H compared hypopharynx squamous cell carcinoma from normal hypopharynx mucosa. The microarray datasets were downloaded from Gene Expression Omnibus (GEO). The GEO asscession numbers associated with the datasets were shown at the top of each panel.

