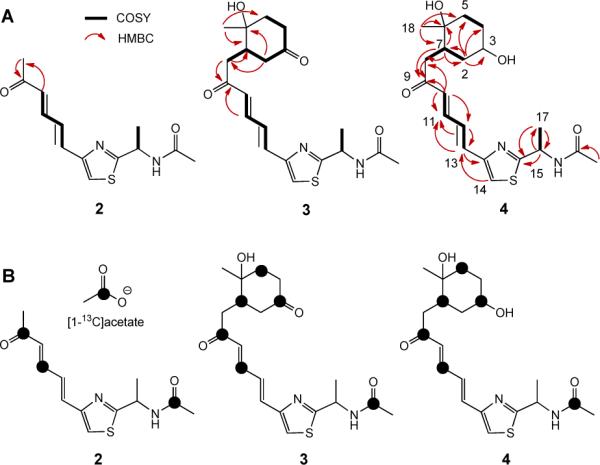
Figure 3.

(A) Key HMBC and COSY correlations for LNM K-1 (2), K-2 (3), and K-3 (4). The similar HMBC correlations of 2, 3 with 4 were omitted for clarity. (B) Specific 13C-enrichment of 2, 3 and 4 resulting from feeding experiments with sodium [1-13C]acetate.
